MRI Atlases
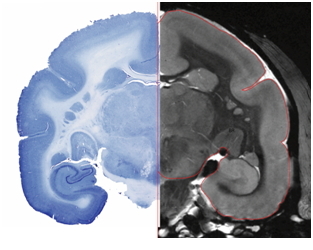 MRI Brain atlases are developed by drawing anatomical and functional regions on high resolution MRI image. Adjacent image shows the quality of MRI scans as compared to histology slices.
MR Imaging:
High-resolution. T2 weighted anatomical images were acquired in a Bruker 7.0T scanner with custom radiofrequency coils to optimize signal contrast and image quality for small animal imaging. A 2D multi-slice Turbo-RARE sequence with fat suppression with following parameters were used TEeff = 48 msec; TR = 5000; RARE factor = 16 ; flip angle = 90°; number of averages 15.
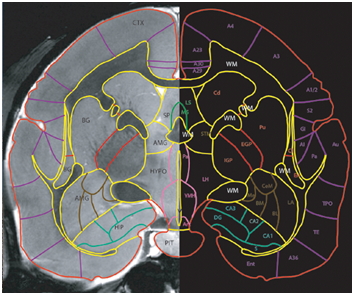 One MRI scan with the best orientation was chosen as standard MRI and for all other MRI scans Intensity normalization was performed based on standard MRI. All MRI scans were registered to standard MRI with affine transform, finally inspecting and ensuring that boundary surfaces of all the scans match as perfectly as possible. An average scan from all the subjects is created. This average scan is used to create a primary Adobe Illustrator (AI) template. For each MRI scan set of AI files (one AI file for each slice) are created and for every MRI scan slices are embedded as a background image. Now Major and Minor Regions are drawn on individual slices of each subject MRI independently consulting background MR image, in some cases it’s histology and reference books.
2D and 3D Atlas:
Adobe Illustrator (AI) drawings are vector graphics, which are mathematical descriptions of drawings that have a relatively small file size and can be scaled virtually infinitely without loss of detail. Pixel-based data are appropriate for the manipulation of digital information (registration, segmentation), but produce crude drawings and very large file sizes.
There are many advantages of vector graphics for illustration but they are computationally incompatible with image processing software. Also due to inherent characteristics of their
creation, which is freehand drawings, they might not comply with strict geometric rules which define the entities represented in the atlases or computer drawings.
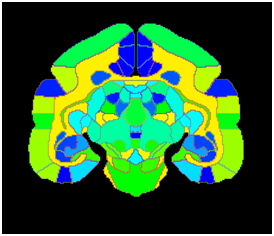
These drawings were converted to 2D slices that delineates each region uniquely with Ekam solutions proprietary software. They are suitable for further numerical analyses such as constructing pixel image data set (of any size) or surface mesh. To use this brain atlas as a template for segmentation and registration, it is converted to pixel images where pixel intensity represents the anatomical area of the brain. Adjacent image shows axial section of brain displayed in pseudo-color in MIVA software.
3D Surface Models
After creating segmented images, surface models were generated using multiple materials marching Cube (M3C) algorithm (Wu, Sullivan et al.). A virtual cube was used to march through pairs of adjacent segmented images in a set. To improve the quality and efficiency of the existing 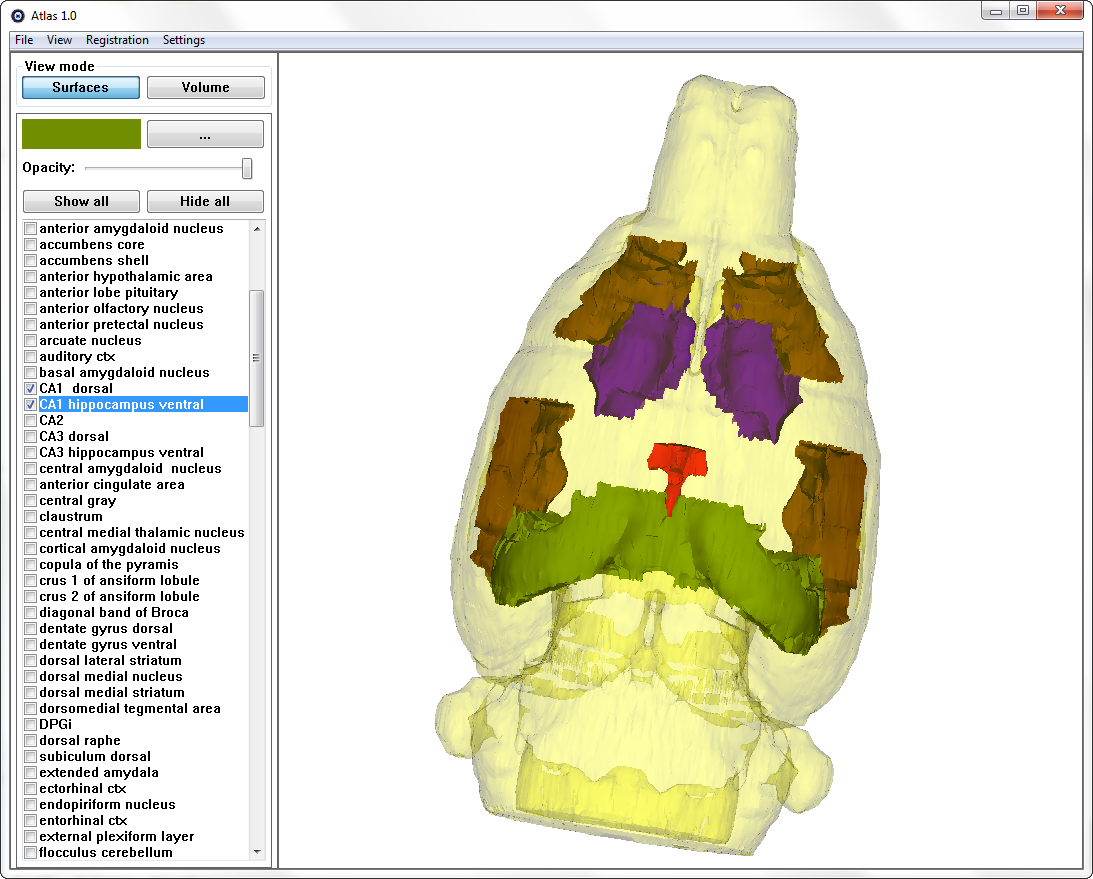 surface model linearization smoothing and decimation was used. Smoothing is a technique that adjusts the node coordinates to improve the appearance of a mesh, and/or improve the shape of surface triangles. Contrary to the smoothing procedure, which does not change the number of nodes and triangles of a surface model, a decimation algorithm reduces the total number of surface triangles, while maintaining a good approximation to the original geometry.